
22 August, 2019
At its July meeting, the Federal Open Market Committee (Fed) cut its baseline interest rate by 0.25%, its first rate cut in more than a decade. Since the last rate cut, they have executed three rounds of Quantitative Easing (QE), significantly reduced the balance sheet from its peak, and then raised interest rates ten times before entering a period of “patient evaluation.” Depending on who you ask, the cut marks either a turn in the business cycle or a minor adjustment in policy. To evaluate which scenario is more plausible, let’s look at how this rate cut compares to those of the past.
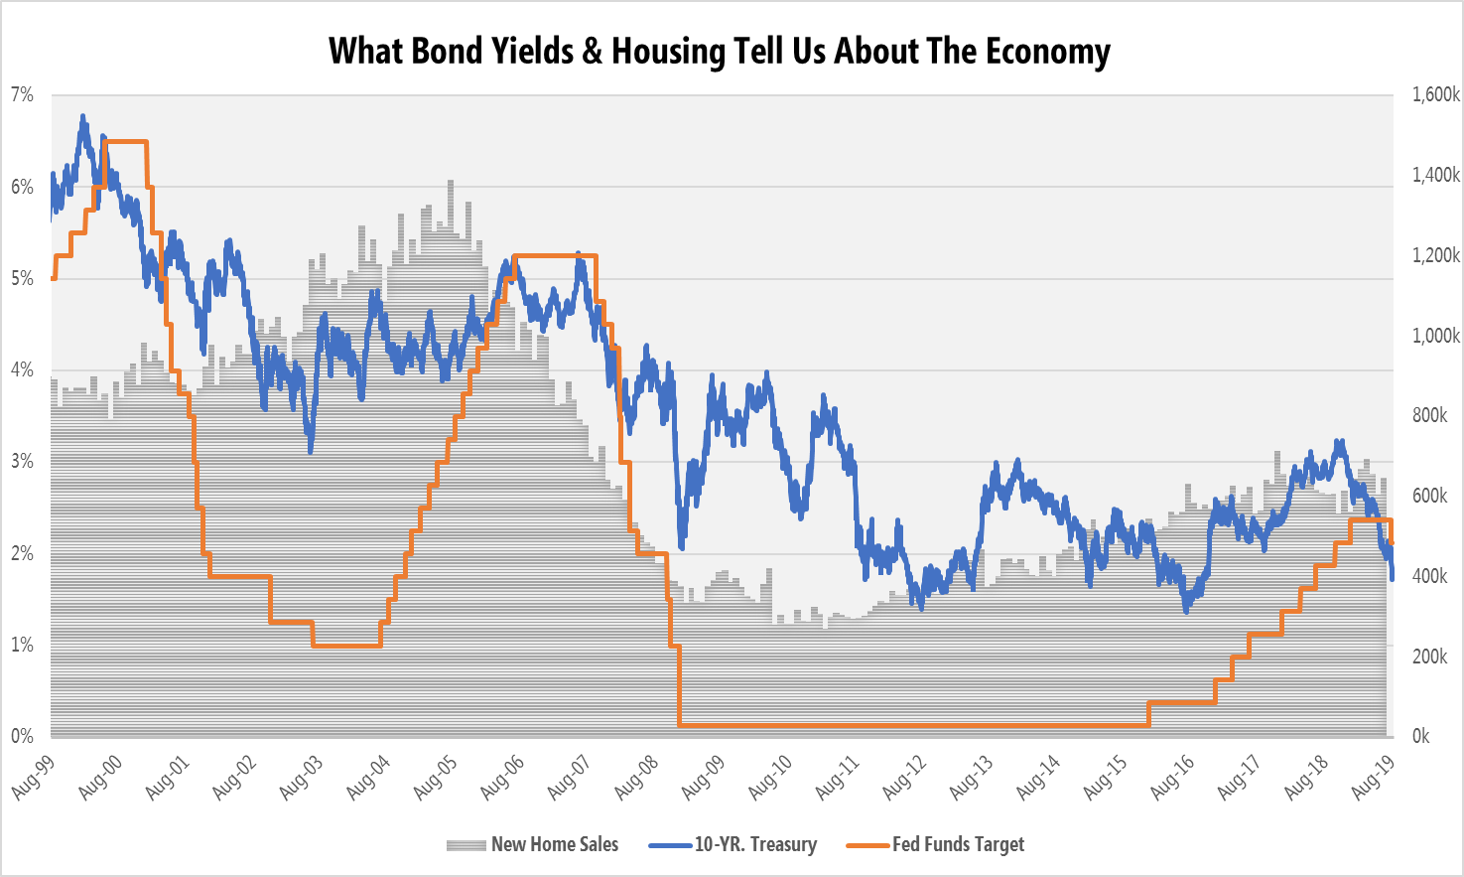
Prior to the recent rate cut, the 10-year yield had fallen 118 bps from its high, falling another 34 bps in the three days following the announcement. After the dot com bubble, 10-year yields fell 187 bps from their peak to when the Fed made their first cut, ultimately leading to a significant drop in the Fed Funds Rate – from 6.5% to 1.75%. As the great recession unfolded in late 2007, the 10-year yield fell 95 bps by the time the Fed made their first-rate cut. In this cycle, the Fed cut rates from a peak of 5.25% to 0%, introducing QE. This is where monetary policy gets complicated in a historical sense!
QE was a new policy tool, and substantially increased the Fed’s balance sheet, which had the effect of pushing down interest rates to the lowest levels in modern history. It can also partly explain the dramatic move in yields following the Fed’s most recent rate cut. Along with cutting interest rates, the Fed announced that they would end their balance sheet runoff early, effectively keeping it larger than previously anticipated.
So, what does this mean for the mortgage industry?
Housing is considered a leading indicator for economic activity, with a downturn in the housing market having precipitated four of the last five major rate cutting cycles. The silver lining here is that while the housing market is no longer growing at the brisk pace it has been since early 2010, we’re not seeing a downturn in the industry yet. Neither new home sales, housing starts, nor construction spending have signaled a significant downturn in activity, lending some support to the view that the Fed’s cut is merely a mid-cycle adjustment rather than the start of an easing cycle.
Where do we go from here?
While Fed Chairman Jerome Powell indicated that this cut was not necessarily a one-and-done move, he did attempt to convey that it was not the beginning of an easing cycle. The economic data supports this view, with employment, GDP, and the housing market still relatively strong.
However, treasury yields appear to be signaling an impending recession, which would likely be met with more easing and lower interest rates. A move downward in yields of 152 bps would certainly be on par with the start of previous economic downturns, and the short-end yield curve inversion is now at pre-crisis levels.
We seem to be at a major inflection point, and only time will tell which view is accurate.
BACK