
Published October 13, 2020
Historically, there has been little to no difference in refinance and purchase rates. A borrower looking to do a rate-term refinance on a primary residence would typically be offered the same rate as they would for a purchase loan on the same property—the market priced these assets as equivalent from a risk/reward perspective. Please note that cash-out refinance loans are excluded from this analysis, as they are viewed as riskier assets and are typically subject to higher borrowing costs.
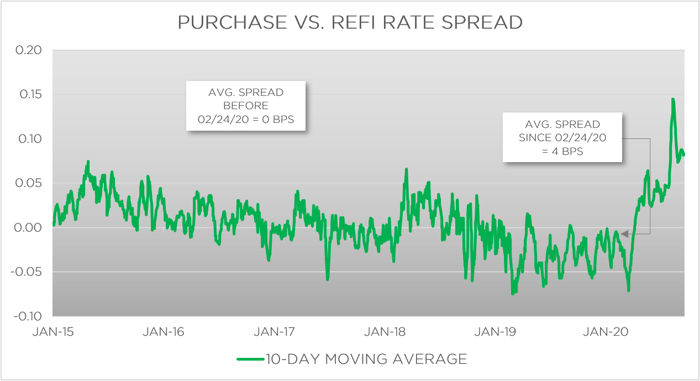
Optimal Blue’s rate lock data since 2015 is displayed in the chart below. One can see that purchase and rate-term refinance rates have tracked nearly in lock step. Before the COVID-19 pandemic, the average delta between rate-term refinance and purchase rates had been 0 basis points and had not exceeded 5 basis points for any extended period.
As we are all painfully aware, however, the current year has been anything but normal. The onset of the COVID-19 pandemic and the subsequent policy responses have shifted the mortgage market into unchartered territory. The result has been all-time low rates, historic volume and a significant bifurcation in refinance and purchase rates. There have been two key events that have driven refinance rates higher than purchase rates:
I. REFINANCE VOLUME SURGE:
The Federal Reserve responded swiftly to COVID-19 by re-engaging quantitative easing measures to avoid a credit squeeze. The aggressive purchase of new MBS came at a time when rates had already been testing record lows and resulted in the most borrower-friendly rate environment in history.
With virtually all qualified borrowers in a position to refinance to a better rate, the volume of rate-term refinances flooded originators and stressed operational capacity. To manage the volume, some originators have raised rates for refinance borrowers above their homebuyer counterparts. On average, refinance borrowers were receiving rates that were 5 basis points above purchase rates from mid-May to mid-August.
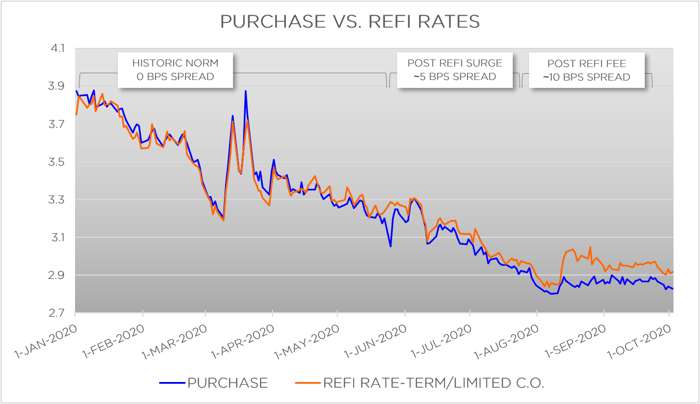
FIGURE2: Purchase vs. Refi Rates
II. CONVENTIONAL LOAN REFINANCE FEE:
In August, Fannie Mae and Freddie Mac announced that they would be implementing an Adverse Market Refinance Fee of a half point for all refinance loans delivered to the GSEs. Building on the already elevated refinance rates, the half point fee pushed the purchase/refi spread to greater than 10 basis points on average.
Later in August, the FHFA directed that the implementation of that fee be moved from September to December, but borrowers saw little benefit—spreads have held at an average of 8 basis points with some lenders advertising up to a 50-basis point rate spread. The chart below shows the distribution of daily 10-day moving average spreads between rate-term refinance and purchase rates since 2015. The current spread is a significant outlier at nearly twice that of any other time in the last five and a half years.
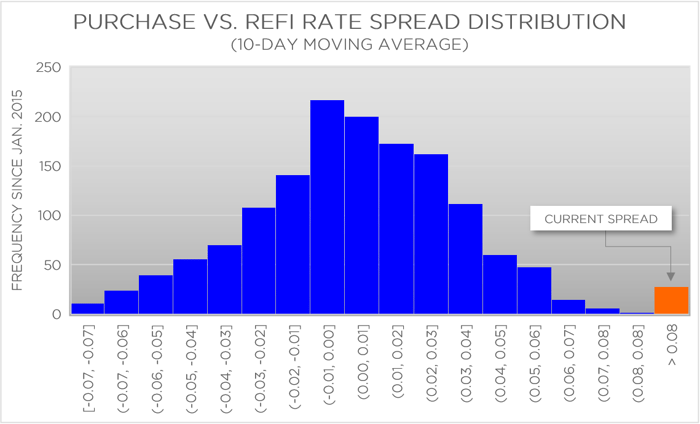
FIGURE 3: Purchase vs. Refi Rate Spread Distribution
The bifurcation in rate-term refinance and purchase rates has implications for all involved industry parties. Consumers looking to take advantage of historically low rates to reduce their mortgage payment must evaluate whether to pay points or settle with a higher than anticipated rate. Lenders must continue to balance their pipeline capacity with staying rate competitive in a high-volume environment.
Further, the true refinance incentive for borrowers is no longer captured by publicly available mortgage rate data sources that do not differentiate between purchase and refinance rates. Servicers and investors evaluating MSR or MBS assets should consider adjusting their primary rate assumptions or leverage alternative data sources to determine prepayment risk in their portfolios.
Optimal Blue’s rate lock data provides its users an unparalleled view into the current rate environment. If you are interested in more refined mortgage rate data or have questions about this article, please contact me directly at boconnell@optimalblue.com.