
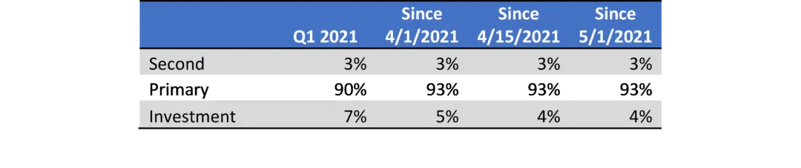
- Loan pipeline data from Black Knight’s Secondary Marketing Technologies group shows the percentage of non-owner-occupied and second-home loans originated has decreased from 10.3% to 6.7% since April 1
- Despite the bulk pricing on second-home loans decreasing an additional 50 basis points back from a securitized execution since May 6, the bulk aggregator pricing spread to a securitization execution on investment properties has increased 40 basis points in that same time frame
- Lenders should consider taking advantage of some of the trends summarized below by managing to a representative sample size of their production for the loan population sold to each investor
Since May 6, the agency caps on non-owner-occupied and second-home properties have continued to add an additional layer of complexity for secondary market participants. Bulk pricing on second homes has decreased an additional 50 basis points (approximately 2 points back of a securitization execution). In financial terms, a 2 point shift in pricing, compared to securitization execution on a $300,000 loan, represents a decrease of approximately $6,000 in the price paid from investors.
Bulk pricing on investment properties has increased 40 basis points over the past week (approximately 25 basis points back of a securitization execution).This upward trend in pricing has been driven by investor appetite for cash-out investment loans with ≤60 loan-to-value ratios (LTVs).
Over the last 30 days, bulk pricing was 40 basis points better than a securitization execution for cash-out investment loans with ≤60 LTV. Even with the increase in pricing over the week, the 25 basis-point decrease in comparison to the securitization pricing increase would represent a decrease of approximately $700 in the price paid from investors for a $300,000 loan since the announcement of the cap.
FIGURE 1
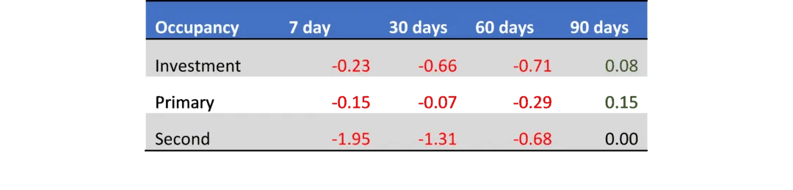
FIGURE 2
Based on the loan sale data that Black Knight’s Secondary Marketing Technologies group observes, 10 of the top 20 bulk aggregators have been below the 7% cap of non-owner-occupied and second homes over the last month. The other 10 that have been over the 7% caps are the investors believed to have private-label security shelves.
To state it differently – despite being over the cap, half of the top 20 can securitize any excess production and still be able to pass through better-than-expected pricing to lenders. Given the fact that some investors can acquire and/or originate more than the cap, and considering the decreasing percentage of non-owner-occupied and second-home loans in the pipelines of our clients, will the investor community have more capacity for these types of loans in the future?
The idea of a lender selling more than the 7% cap to a specific investor can be corroborated by data from Black Knight’s Secondary Marketing Technologies group. Of our lender population that is selling loans to aggregators via a bulk basis, 55% have sold more than 7% of their non-owner-occupied and second-home loans to an individual investor.
There can be a couple of strategies afoot here, including the idea of expanding the “denominator” of primary occupancy loans that the agencies are using to determine their caps. The amount of primary occupancy loans that have been delivered to agencies has increased by 3% (from 89% to >92%) since the announcement of the cap.
FIGURE 3

Secondary marketing departments should continue to monitor and control non-owner-occupied and second-home properties through margin strategies. The effect of this policy change has highlighted the need for secondary market participants to begin to manage the sample size of loans delivered to a particular investor.
Selling a representative sample size of a lender’s production to a particular investor helps prevent negative impacts in future pricing caused by selling one particular investor an outsized share of a particular loan type such as 20% high balance or non-owner-occupied loans in a given time period.
To restate more simply – if VA loans represent 20% of your production, then the portion of loans sold to each investor should be made up of 20% VA loans, regardless of the amount sold, without explicit authorization from or communication with your investor. There have even been whispers in the past of specific investors engaging in deals with specific lenders on the amount of certain loan types that could be delivered (e.g., 10% high balance loans) without the impact of a loan-level price adjustment.
As caps for certain production qualities become more widely used in the industry, secondary marketing participants will need a way to include this level of conditionality in their best execution. Of the 50% of the investors who have bought more than 7% of non-owner-occupied and second-home loans, the majority have an average spread over securitization that is worse than the average spread mentioned in the beginning of this blog inferring that if you exceed caps for certain production qualities, pricing may decrease.
Managing the cohorts that lenders deliver to investors may not have an impact on lender pricing today, but it can have a notable one down the road. CompassPoint clients can continue using the solution’s aggregate pooling stat tools to implement granular, monthly cohort delivery caps in their daily best execution.
The aggregate pooling stat tool helps lenders incorporate loan criteria, such as FICO score, property state, property occupancy, property type and other data considerations across delivery time frames (e.g., monthly or quarterly) to deliver a consistent loan profile and mix to each investor. The aggregate pooling stat tool not only tracks the deliveries made to specific investors, but also automatically moves loans during the best execution process to deliver a consistent loan profile whenever possible.
Lenders can ask themselves if short-term best execution on single loans compensates for poorer execution on multiple loans in the future. For example, is an extra 10 basis points today worth material decreases in pricing in the future because Investor A received too much of a particular loan this quarter?
Black Knight is committed to continuing to help secondary marketing teams navigate these questions and more. Check out our blogs from April 21 and May 6, and stay tuned for further assessment of the impact of the agency cap in future articles.