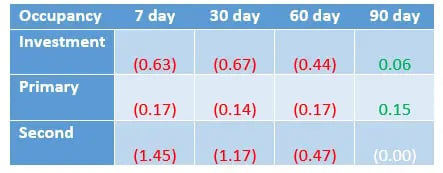
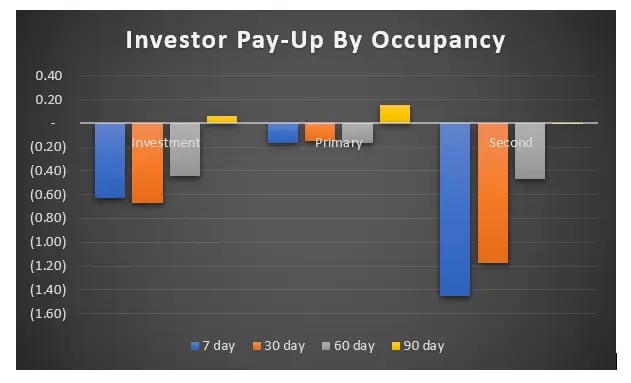
- Loan sale data from Black Knight’s Secondary Marketing Technologies group shows bulk pricing on second homes faded approximately 50 basis points over the last two weeks
- Additional loan sale data from the group shows bulk pricing on investment properties increased approximately 10 basis points this month
- With Investors making pricing changes via rate sheets or bulk pricing, lenders should actively ensure that rate sheet pricing is equal to or worse than current market bids; they should also anticipate pricing to further worsen
Since the time of our last blog, the agency caps on investment and second-home properties have continued to add stress to the secondary market. Bulk pricing on second homes has decreased an additional 50 basis points (approximately 1.5 points back of a securitization execution). In financial terms, a 1.5 point shift in pricing, compared to securitization execution on a $300,000 loan, represents a decrease of approximately $4,500 in the price paid from investors.
Bulk pricing on investment properties has increased 10 basis points over the last two weeks (approximately 65 basis points back of a securitization execution). Even with the increase in pricing over the last two weeks, this 65 basis-point decrease in comparison to securitization pricing increase would represent a decrease of approximately $2,000 in the price paid from investors for a 300,000 loan.

Bulk pricing isn’t the only outlet in which we’ve observed a decrease to account for the agency cap on non-owner-occupied properties. Our clients have seen best efforts pricing decrease materially as well. In some cases, investment and second-home loan-level price adjustments (LLPAs) have increased by 1-2 basis points in comparison to the agency LLPA grids for those properties.
Specified pay-ups through the agency cash windows have also decreased materially for investment properties post-announcement. Historically, a pay-up was provided for investment properties to accommodate the expectation of lower prepayment speeds as compared to primary-occupancy loans.

Across our client base, the average difference between the standard Federal National Mortgage Association (FNMA) cash price and the FNMA cash investment price for the entire note-rate stack is currently negative 21 basis points. Getting more granular, and observing an individual rate, the 3.5 passthrough pricing difference between the standard and investment pricing was 33 basis points on Feb. 1. As of April 30 at market close, the spread between the two prices is negative 21 basis points, which infers a 50 basis-point decrease since the cap announcement.
Secondary marketing departments should continue to monitor the market for non-owner-occupied properties given the rapid changes. The effect of this policy change has impacted the way lenders deliver to the agencies, lock loans best effort, and sell mandatory locks to bulk aggregators; no outlet has been totally unscathed.
The non-owner-occupied delivery cap reinforces the necessity of flexibility for lenders and secondary marketing departments. Pricing to a mandatory proprietary rate sheet, as opposed to an investor’s best-efforts rate sheet, gives lenders more flexibility in terms of pricing. Rather than being at the mercy of specific investors’ rate sheets, lenders can take back control by accounting for and accommodating changes like the non-owner-occupied cap.
