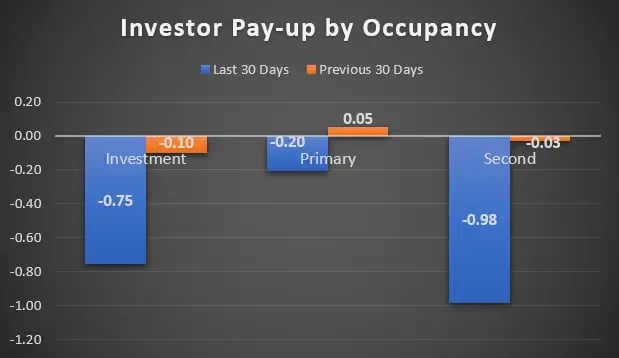
- Loan sale data from Black Knight’s Secondary Marketing Technologies group shows bulk pricing on investment and second homes fading by approximately 75 basis points in the last month, following the GSE announcement
- Lenders need to take an active approach to applying extra margin and loan-level price adjustments (LLPAs) to these loans to account for actual bids observed in the marketplace on these products
The recent announcement from Fannie Mae and Freddie Mac regarding caps on investment and second-home properties has already sent ripples through the mortgage community. In separate letters to lenders, both agencies announced that there would be a 7% limit on the acquisition of these types of properties.
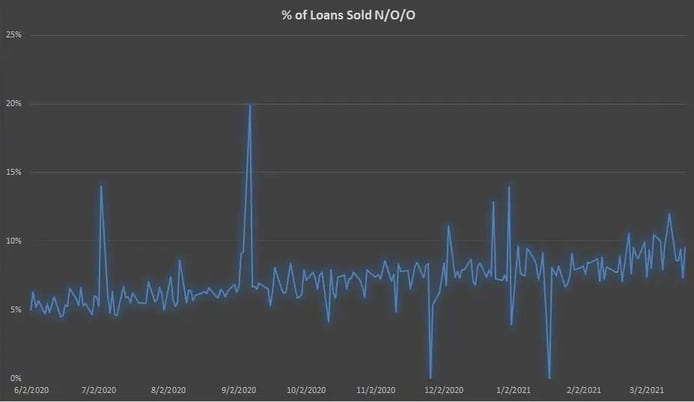
Based on data from lender clients of Black Knight’s Secondary Marketing Technologies group, non-owner-occupied homes typically make up approximately 10% of lender originations. And, according to Black Knight’s loan sale data, the percentage of these properties has nearly doubled since the middle of 2020.

While there were no additional loan-level price adjustments (LLPA) levied by the agencies at this time, the 7% cap is causing headaches for secondary marketing managers. Not only do these professionals have to more closely manage the population of loans delivered to the agencies, but they are seeing other investors begin to follow suit, imposing their own caps and/or back off pricing for investment and second home properties. With the proliferation of bulk executions and decrease in assignment of trade/direct trade execution in recent years, understanding what investors are paying up or down for has become shrouded in mystery. With little to no rate sheets or LLPA grids to provide guidance on what investors are craving, it’s no surprise lenders are unsure how to adjust their own pricing and margins.
In the Secondary Marketing Technologies group, we review our entire client base to track investor performance compared to securitization execution to derive pay-ups for specific loan characteristics. As you can see in the chart below, we have seen investors back off of their bids over the last month across all products, but especially on investment and second homes.

Investment properties decreased 65 basis points month over month, and second homes dropped 95 basis points over the same period. In dollar terms, a 65 basis-point shift in pricing on a $300,000 loan would represent a decrease of approximately $2,000 in the price paid for the loan from investors. Second homes could expect a decrease of approximately $3,000 on a loan of the same amount.
This decrease in appetite from investors will impact the bottom line for all lenders, especially those who don’t account for it at origination. Based on this data, lenders need to consider building in extra margin and/or LLPAs for these loans to account for the actual bid pricing being observed in the marketplace. This data has potential to change drastically in the coming months as more data becomes apparent, of course, and as more stories surface about the ramifications of exceeding the agency caps.
Non-owner-occupied mortgages deserve their full share of attention from secondary marketing departments, and as always, stay in touch with your hedge advisors.
