
02 May, 2019
Optimal Blue recently released a suite of indices known as the Optimal Blue Mortgage Market Indices (OBMMI™). These indices are calculated from actual locked rates with consumers across more than 30% of all mortgage transactions nationwide and are developed around the most popular mortgage loan products and specific borrower attributes.
Rates have been falling steadily since mid-November 2018 and particularly sharply in March 2019. Specifically, the average 30-year conventional conforming 30-year rate fell from 5.16% in November 2018 to 4.55%in March 2019. This drop was enough to spark a surge in mortgage consumer lock volume, with lock activity increasing by approximately 2.5% in Q1 2019 relative to Q1 2018.
Despite the drop in mortgage rates which is normally associated with signs of economic weakness, the economy has continued to show strong signs of growth, with unemployment at 3.8% in February and GDP growth at 2.6% in the fourth quarter of 2018. And signs of strength are also apparent in the housing market, with the monthly purchase only House Price Index showing a 0.57% increase in January.
However, some market indicators suggest that an economic slowdown could be around the corner. In particular, the spread between 2-year and 10-year Treasury securities has narrowed since mid-2018 which is indicative of a weakening economy. When the 10-year Treasury yield is near or less than the 2-year Treasury yield, it implies that markets expect the Federal Reserve to eventually reduce short term rates, a process which is generally associated with an economic slowdown. This expectation is supported by Federal Reserve Board statements indicating that they do not plan to raise rates the rest of the year and that they are slowing the runoff of the balance sheet.
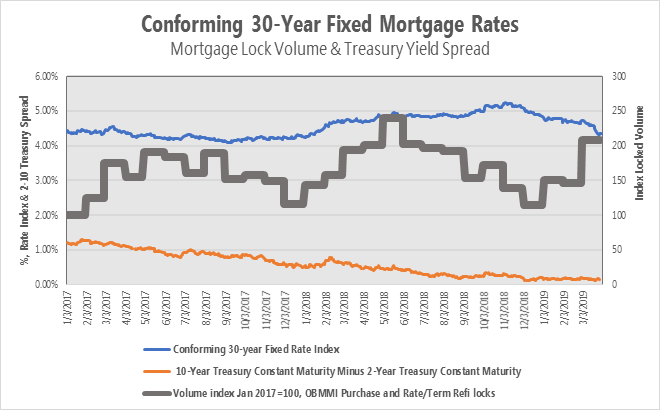
The chart shows the Optimal Blue conforming 30-year fixed index plotted with the 2-10 yield spread, and indexed volumes of locked loans through the Optimal Blue product and pricing engine. Note that the yield spread has been low for a while, coinciding with the fall in rates. Unsurprisingly, the stark decline in rates has led to an uptick in mortgage activity.
Sources:
Federal Reserve Bank of St. Louis, 10-Year Treasury Constant Maturity Minus 2-Year Treasury Constant Maturity [T10Y2Y], retrieved from FRED, Federal Reserve Bank of St. Louis;
https://fred.stlouisfed.org/series/T10Y2Y, April 2, 2019.
Optimal Blue, OBMMI, Conforming 30-Year Fixed Rate index, https://www2.optimalblue.com/obmmi/, April 2, 2019
Optimal Blue, internal locks volume information
U.S. Federal Housing Finance Agency, Purchase Only House Price Index for the United States [HPIPONM226S], retrieved from FRED, Federal Reserve Bank of St. Louis; https://fred.stlouisfed.org/series/HPIPONM226S, April 2, 2019.
U.S. Bureau of Economic Analysis, Real Gross Domestic Product [A191RL1Q225SBEA], retrieved from FRED, Federal Reserve Bank of St. Louis; https://fred.stlouisfed.org/series/A191RL1Q225SBEA, March 27, 2019.
U.S. Bureau of Labor Statistics, Civilian Unemployment Rate [UNRATE], retrieved from FRED, Federal Reserve Bank of St. Louis; https://fred.stlouisfed.org/series/UNRATE, April 2, 2019.
BACK